-
Docker로 prometheus와 node_exporter , grafana 연동하기인프라/Docker 2022. 7. 11. 19:29728x90
Prometheus 설치.
1. prometheus의 설정 파일 삭정
$ sudo vi /tmp/prometheus.yml2. prometheus.yml 파일작성
global:
	scrape_interval: 15s
    evaluation_interval: 15s
*global : 전체설정 , scrape_interval : 정보를 수집하는 텀.
3. docker prometheus 실행
$ sudo docker run -p 9090:9090 -v /tmp/prometheus.yml:/etc/prometheus/prometheus.yml prom/prometheus* prometheus 를 설치하면 /etc/prometheus 에 우리가 작성했던 prometheus.yml 파일을 매핑 시킨다.
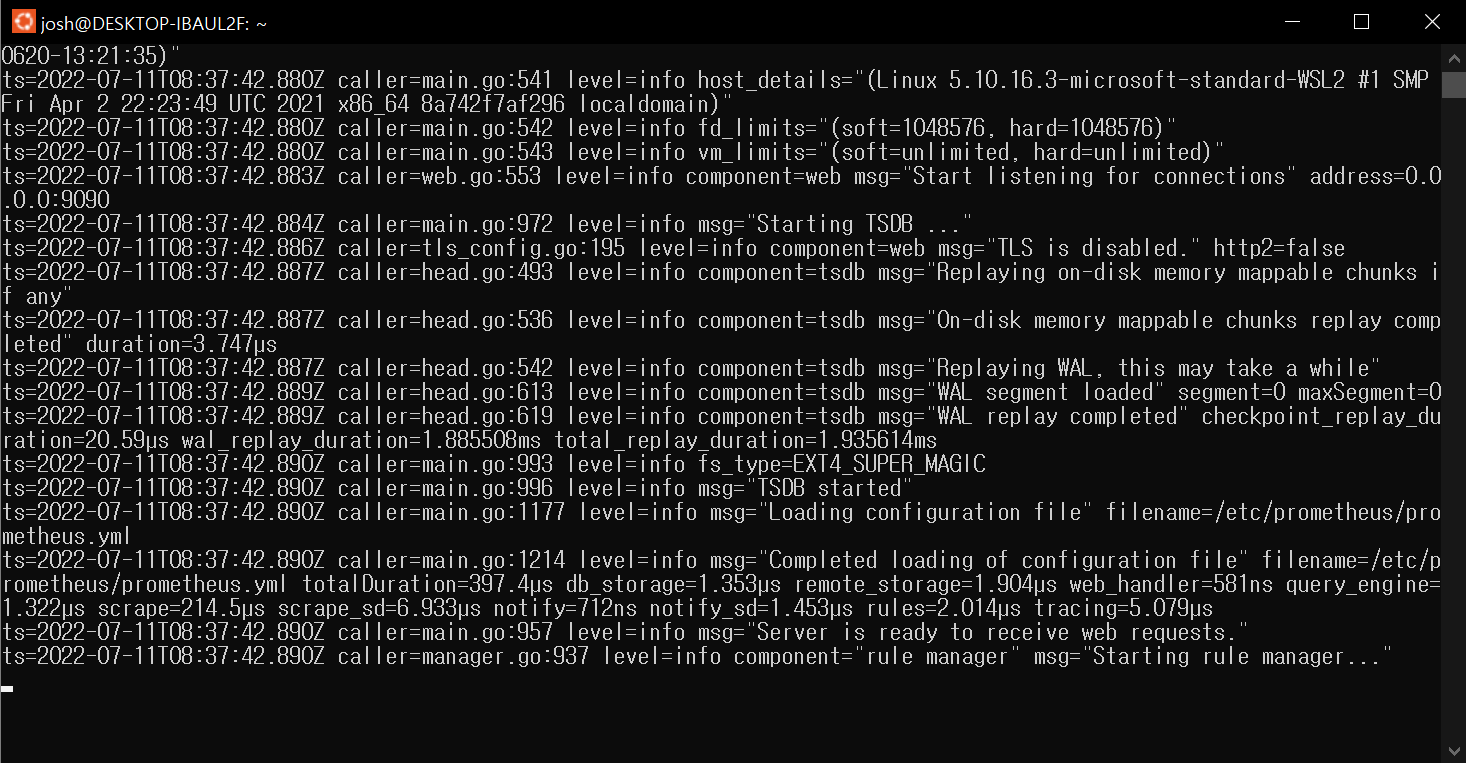
4. prometheus 접속
localhost:9090
5. Status - target 보기
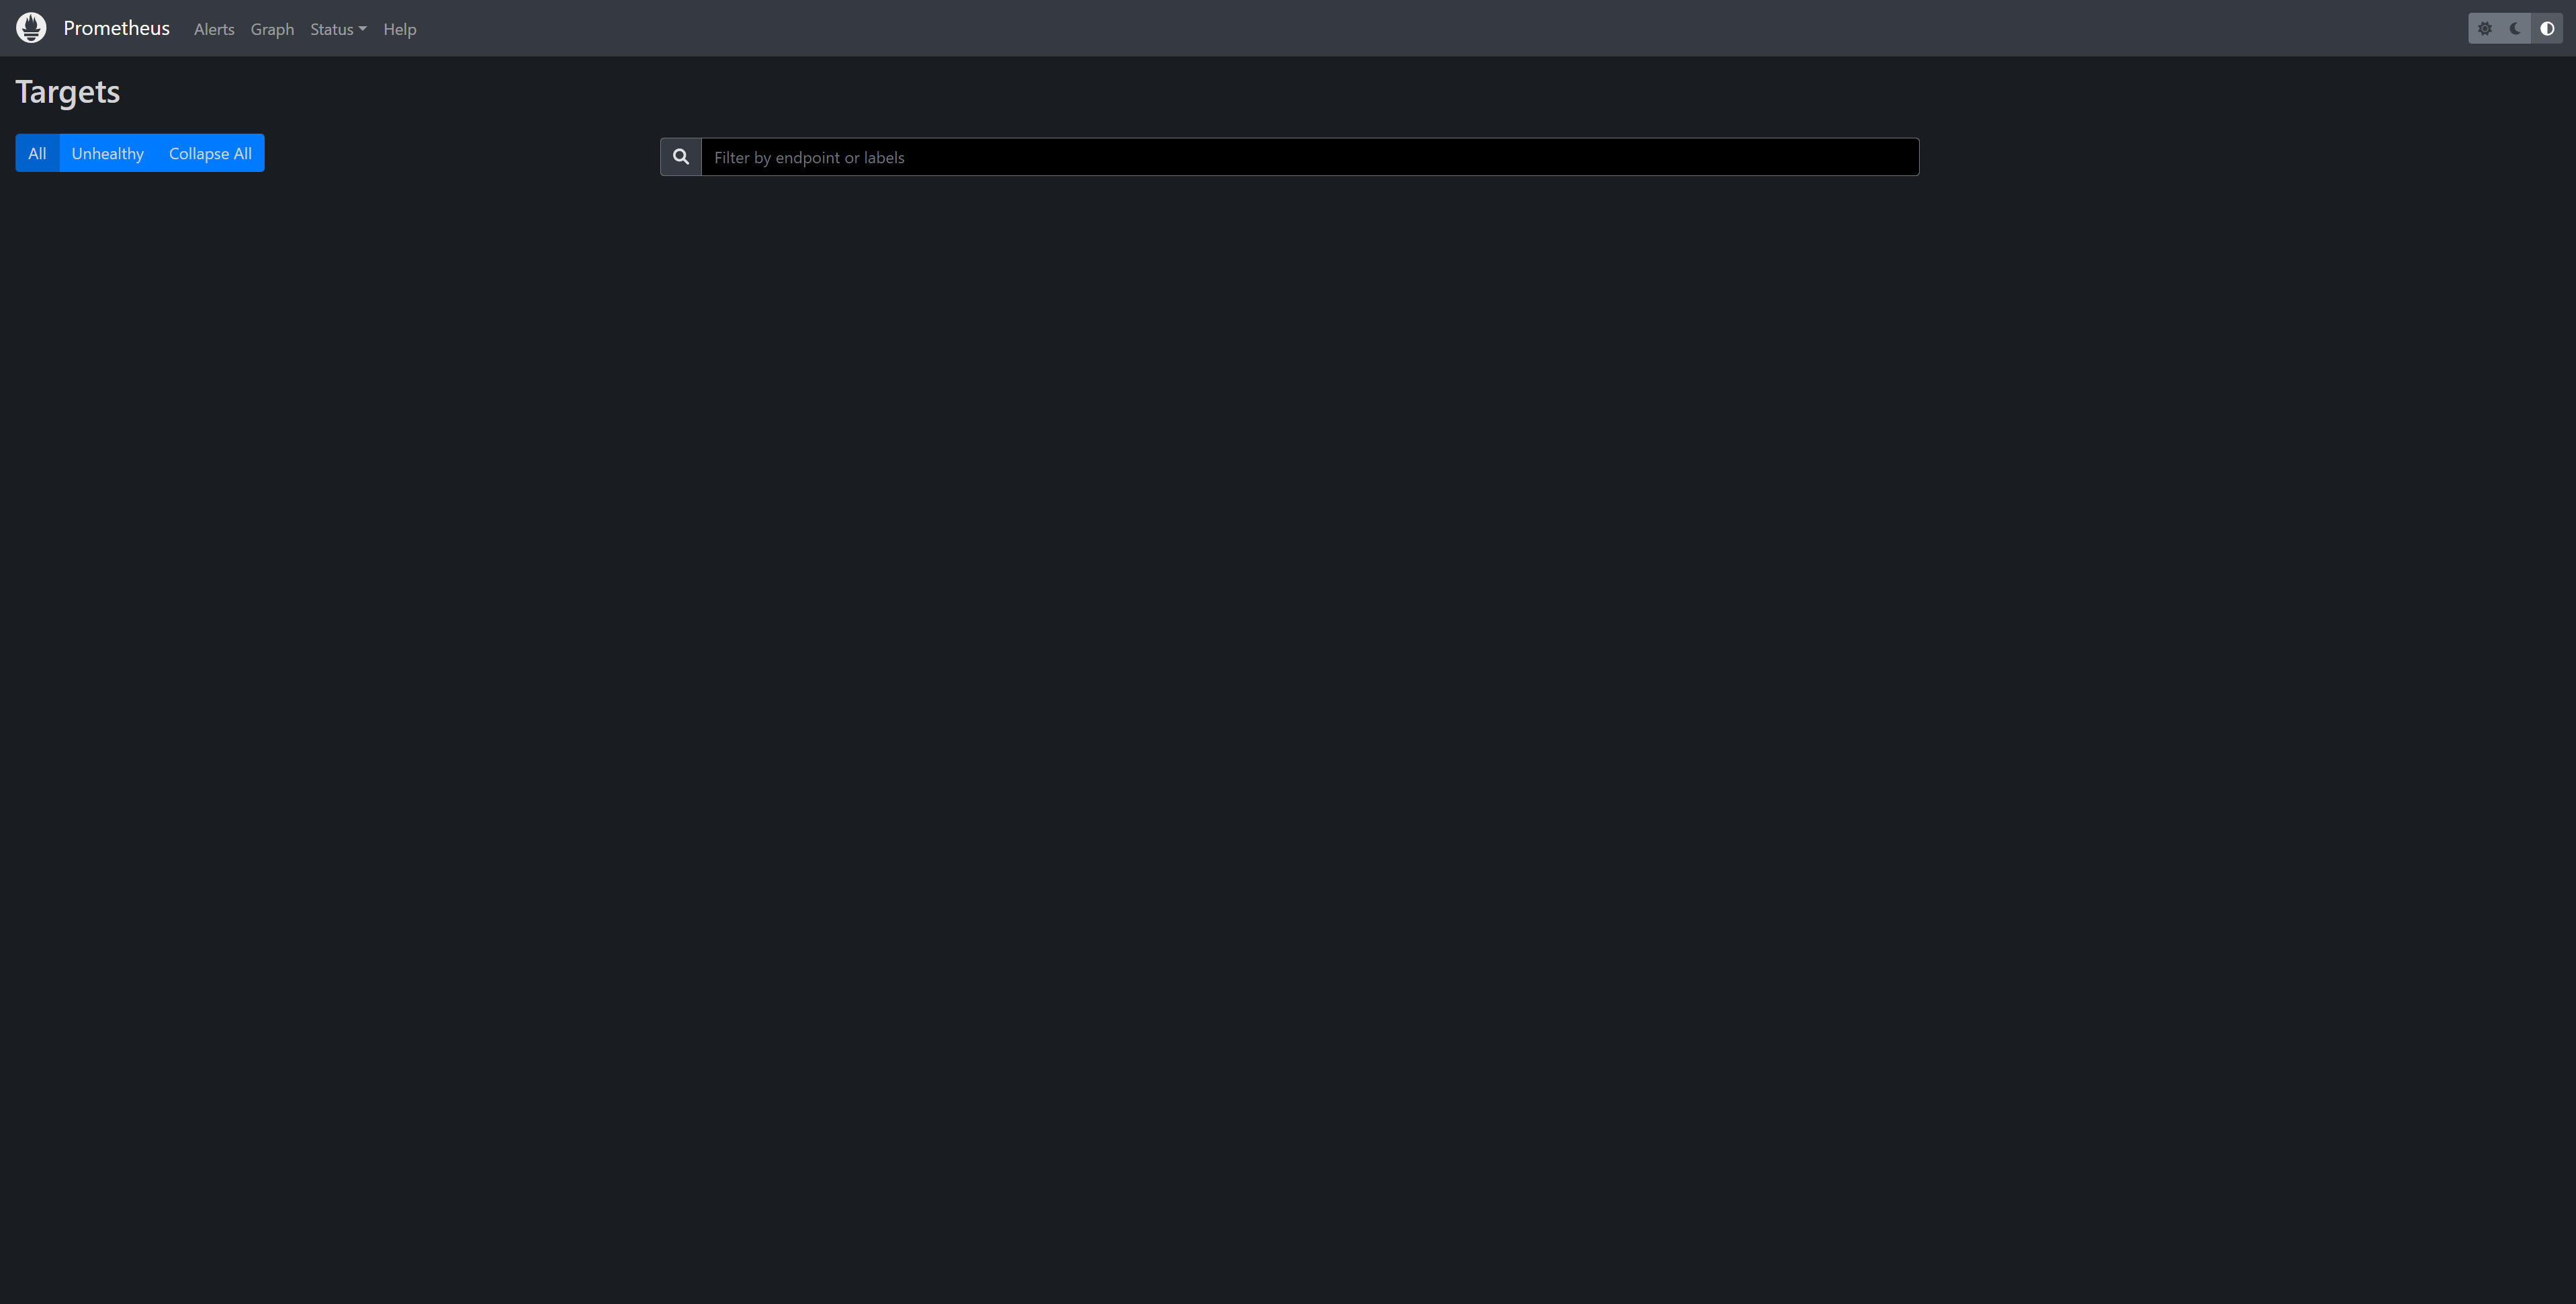
여러가지 exporter, actuator prometheus 를 설정하면 여기에 그 목록이 나온다. * 다음부터는 docker run 명령어에 -d 를 추가하여 백그라운드로 돌릴 예정...
Node_exporter 설치
* Ubuntu 서버의 metric을 조사하는 것이기 때문에 Docker로 구동하지 않는다.
1. wget 으로 설치
wget wget https://github.com/prometheus/node_exporter/releases/download/v1.1.2/node_exporter-1.1.2.linux-amd64.tar.gz2. 압축 해제 후 nohup 으로 백그라운드 실행
$ tar xvfz node_exporter-1.1.2.linux-amd64.tar.gz
$ cd node_exporter-1.1.2.linux-amd64/
$ nohup ./node_exporter &
3. node_exporter 접속 확인
localhost:9100/metrics
3. Prometheus.yml 에 node_exporter 연결하기
1. prometheus.yml 수정
$ sudo vi /tmp/prometheus.yml
이렇게 작성한다. ** Node_exporter는 Docker 가 아닌 Ubuntu에 직접 설치 했기 때문에 hostname -I 로 실제 IP 주소로 입력한다.
2. prometheus 재시작
$ docker ps
$ docker restart (container_id) --ex)dfb8fb9a1738
STATUS를 보면 container가 재시작 했는지 알 수 있다. 3. prometheus - Status -target 확인

* prometheus 도 서버이기 때문에 자체 metrics 정보를 확인 할 수 있다.
4. Grafana에 Prometheus 연결하기
1. 저번에 만든 Grafana 접속
localhost:3000
2. Configuration - Data Source - prometheus 선택

Add data source 클릭 
prometheus 선택 3. prometheus url 정보 입력 후 테스트
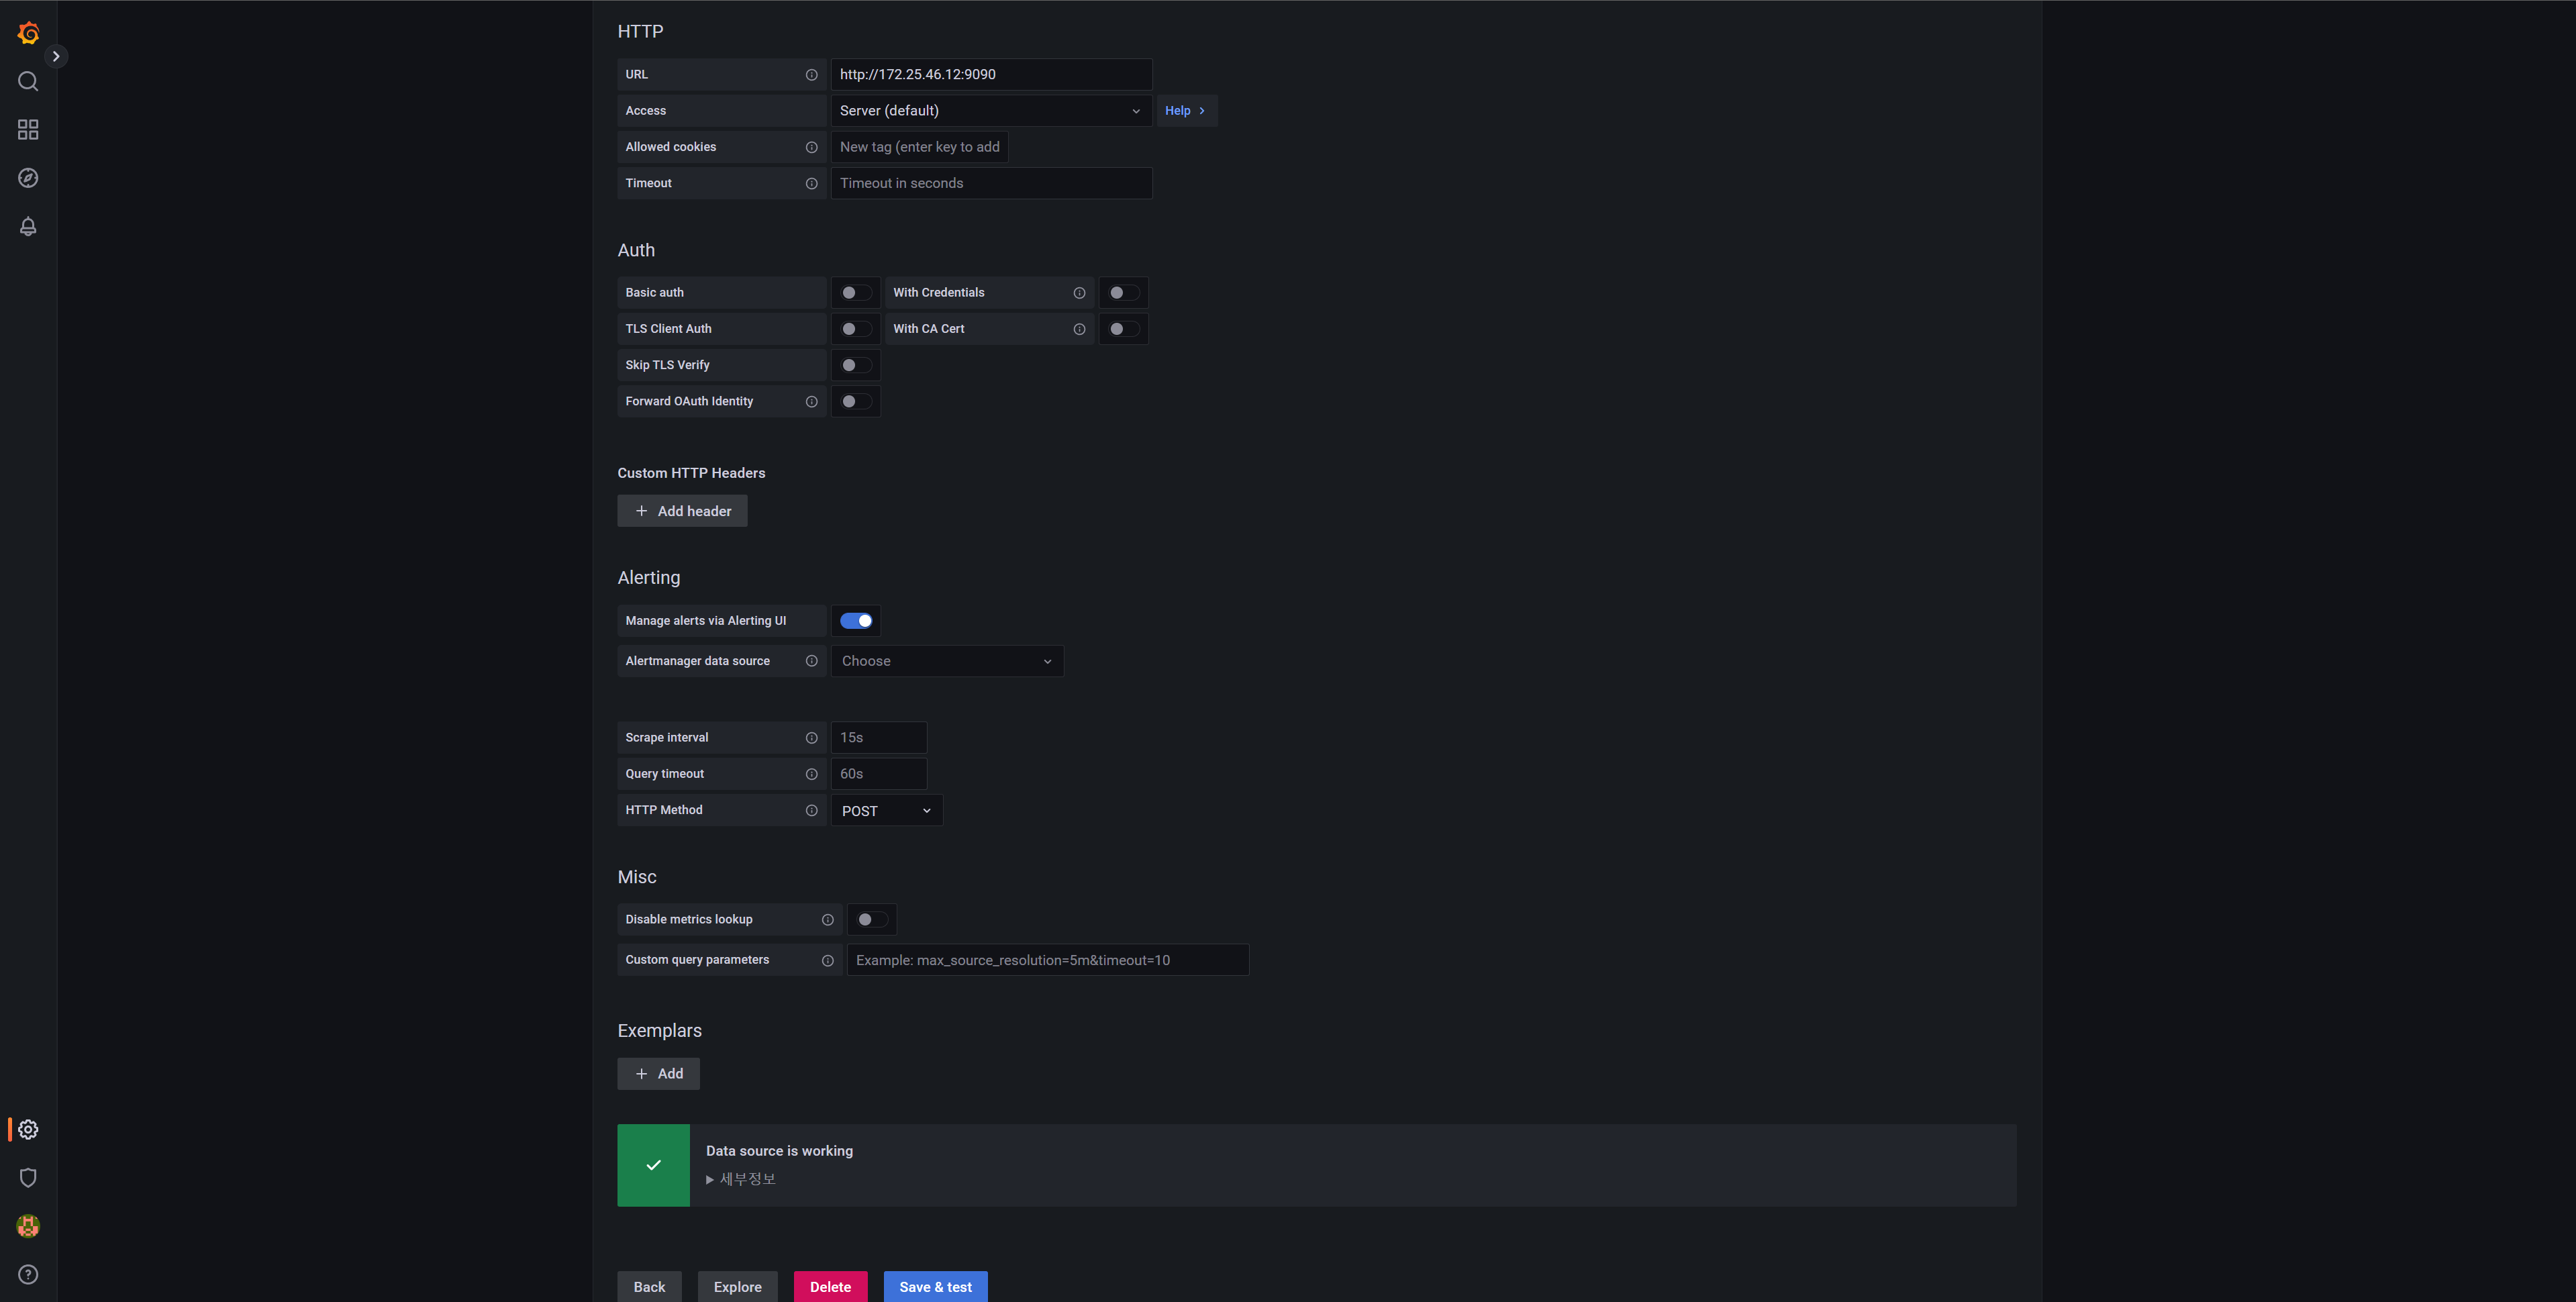
URL 앞에 http:// 잊으면 안된다. 4. Save & test
5. grafana - node_exporter 템플릿 설정 (https://grafana.com/grafana/dashboards/1860)

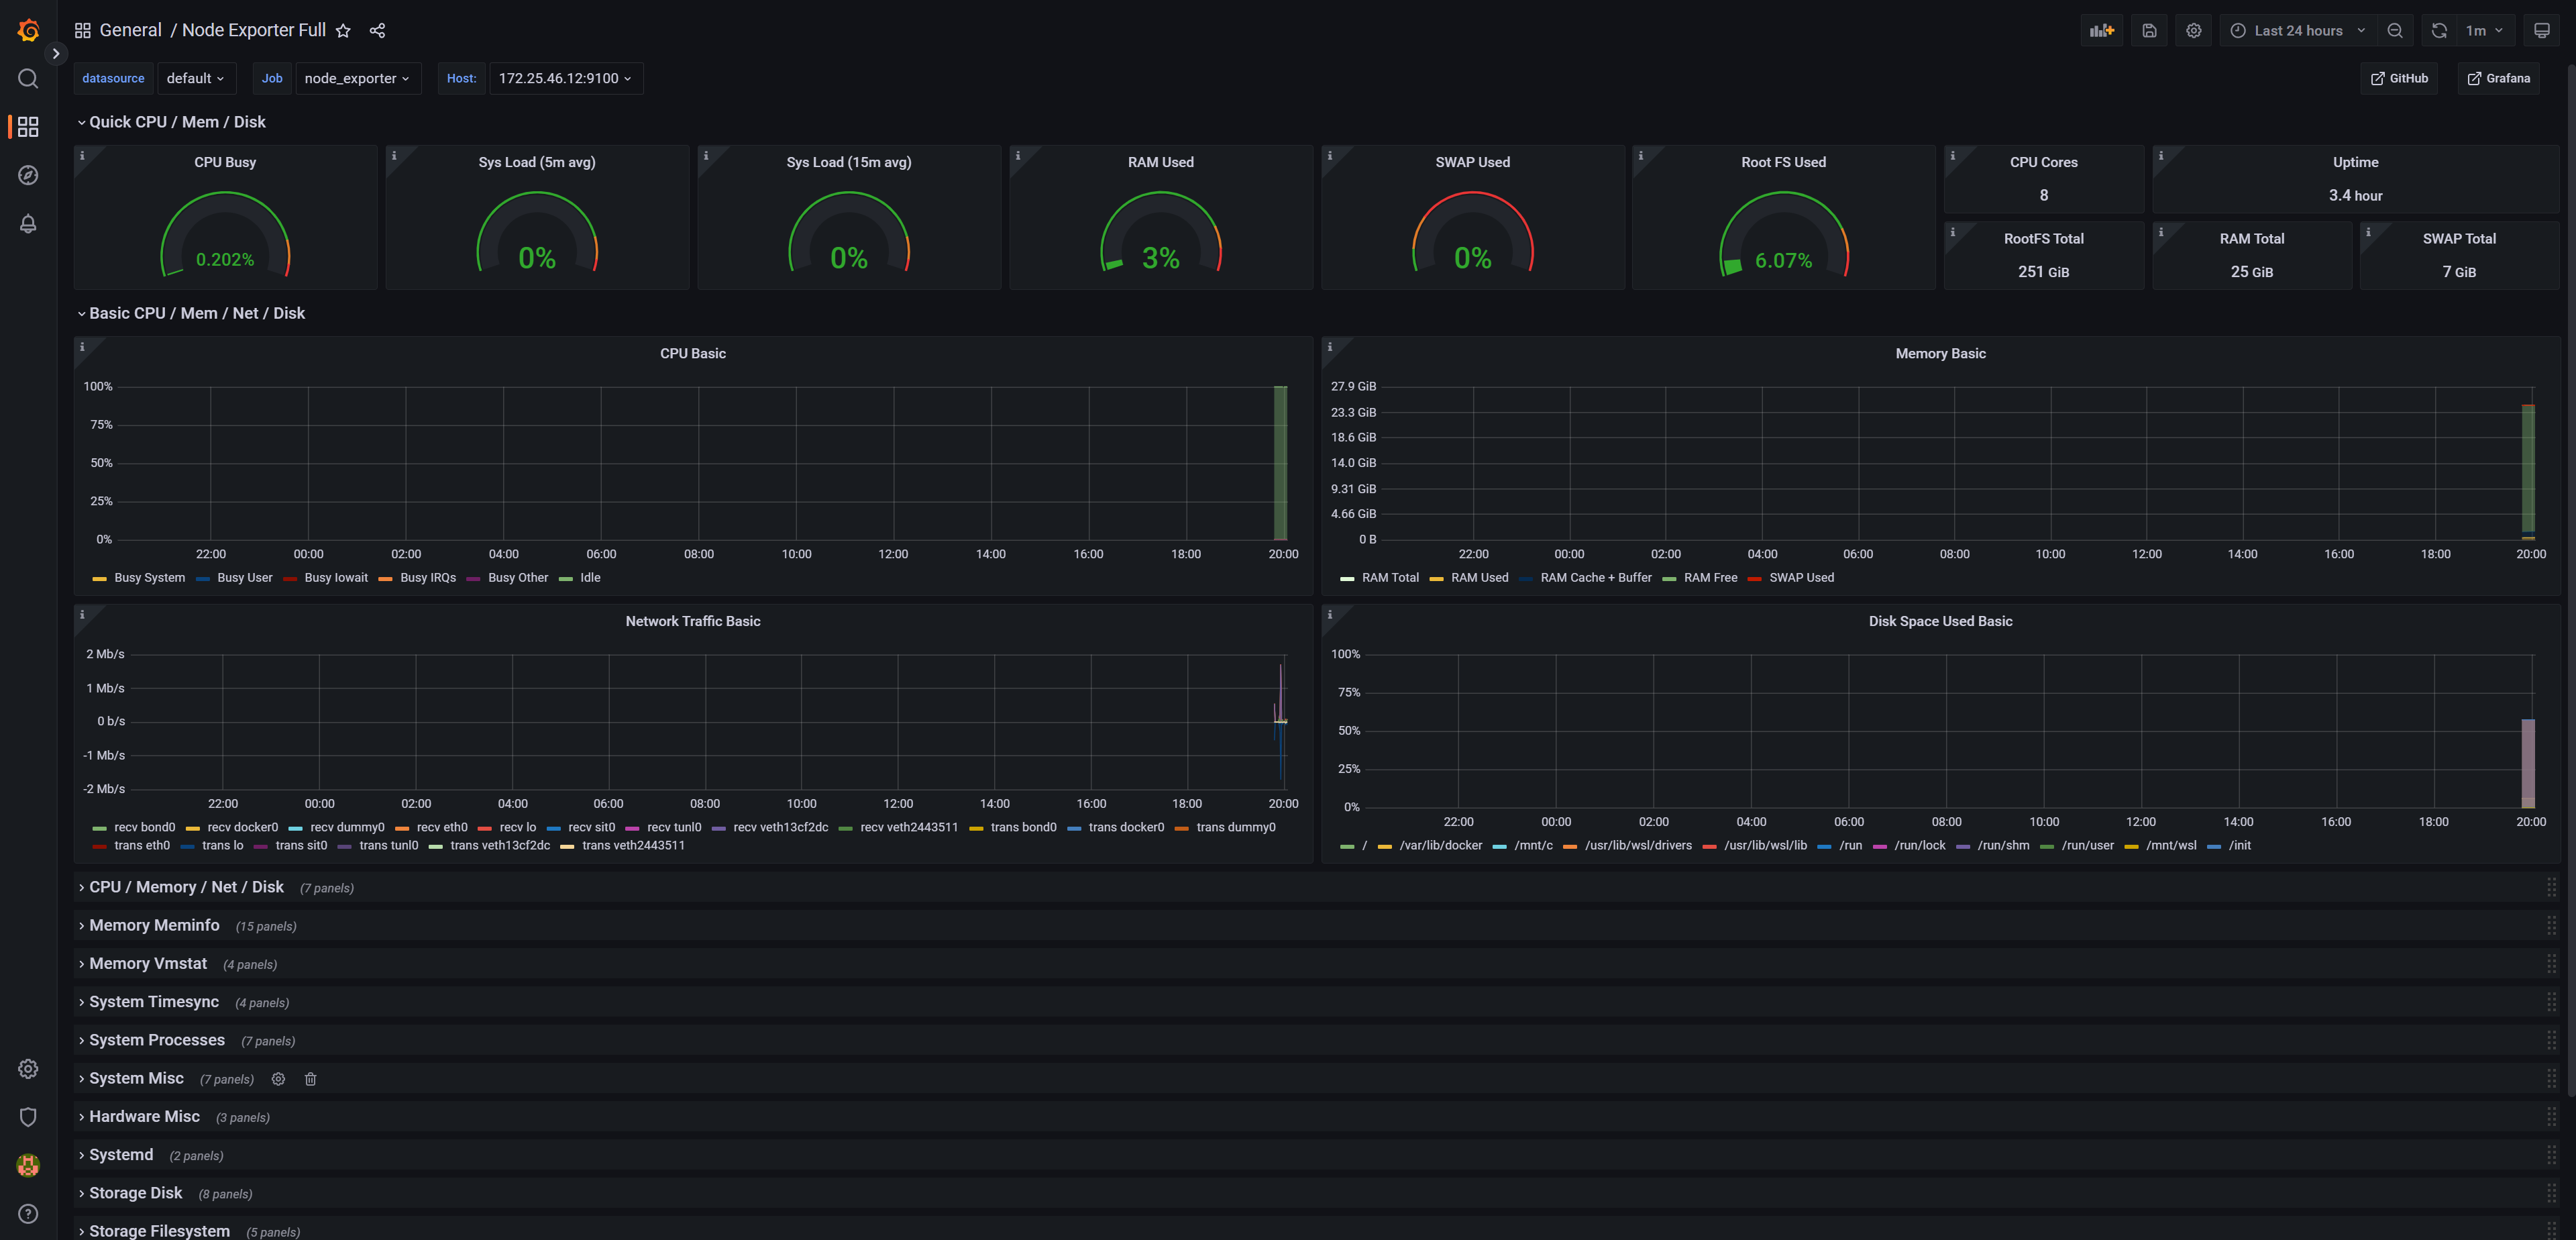
Reversions 선택 후 첫번째꺼 다운로드 6. grafana : dash board - import 선택 후 다운로드 받은 json 파일 업로드 , prometheus 선택

import 클릭 7. Dashboard 확인
 728x90반응형LIST
'인프라 > Docker' 카테고리의 다른 글
Docker로 Grafana 구축하기. (0) 2022.07.11 Window10에서 Docker 설치하기 (0) 2022.07.11